
Half-Time Goal Method
- Betfunder

- 22 apr 2022
- Tempo di lettura: 4 min
Aggiornamento: 12 set 2022
A study on Ebertin’s midpoints and their betting applications.
The Half-Time Goal Method to predict at what time goals are likely to be scored in soccer games.
The experiment presented in this section was made in an attempt to demonstrate any statistical relevance of certain planetary aspects defined midpoints (according to the terminology of their discoverer and theorist Reinhold Ebertin) appearing at the exact time and place in which goals were scored in the first 45 minutes of each Italian Serie A League match in 2013/14, 2014/15 and 2015/16 seasons.
The edge of using midpoints is that you can take advantage of the individual points of an astral chart, namely Ascendant (AS) and Midheaven (MC), respectively the ecliptic degree that rises on the eastern horizon at the time of birth – or time of goal in this case – and the culminating point of the vertical angle from the venue where the game take place.
In order to prove a correlation to the prospect of either team to score a goal in the first half of a game, we consider only the combinations of midpoints having as factors in the equation at least one of the two individual points of the chart, namely ASC and MC. Using a close orbit of one and a half degree (1.5°) we are able to highlight the midpoints that appear with greater frequency when a goal is scored. That is very useful data in trying to identify those short periods within the game when scoring is more likely.
The group of data examined includes 1,250 goals scored in the first 45 minutes of Italian Serie A matches between 2013 and 2016. We calculated the average frequency % of each combination of midpoints having at least one of ASC and MC into its factors, dividing by 3 the values of the only three possible equations (e.g. MC = Sun/Moon, Sun = MC/Moon, Moon = MC/Sun). A weighted average was then obtained by adding that average value to the frequency % of the one equation with individual point as a focal point (in our example: MC = Sun/Moon), the only one that will be considered in our analysis. We subsequently subtracted from the obtained values the average presence % of all the midpoints, so to obtain an average frequency deviation for each combination, positive or negative. For example: ASC = Sun/Venus equation gave negative value -1.2, that is to say that the frequency of the equation ASC = Sun/Venus (weighted together with Sun = ASC/Venus and Venus = ASC/Sun) is 1.2% less than the average of all the others.

In a nutshell, although the presence of this midpoint is not in itself an indication of a probable goal (being its negative value), added to the value of other midpoints active simultaneously but with a positive value, it could also not be decisive in the general computation.
The following table shows the percentage deviations (equal to or greater than 1%) obtained from all the equations of midpoints, ordered from the highest negative value on the left and the highest positive value on the right side (that therefore highlights combinations of midpoints that appear more often at the time when a goal is scored in a football match).
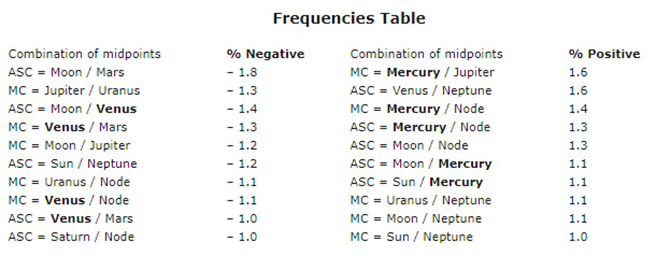
Noteworthy is the presence of Venus 4 times in the first 10 combinations of midpoints appearing less frequently at the time of a goal scored. This data is curious but in line with the typical nature of this planet that, according to classical astrological tradition, is "devoted to comfort and pleasure" (cfr. The Complete Idiot's Guide to Astrology by Madeline Gerwick-Brodeur, Alpha, 2007) more than to self-discipline. "A lack of willpower indicate an afflicted Venus in a chart" as Joanna Martine Woolfolk writes in her best-selling The Only Astrology Book You'll Ever Need: Twenty-First-Century Edition (Taylor Trade Publishing, 2012).
The peaks on the Scoring Timeline graphs shown below in this section represent the highest probabilities for either team to score during the game based on our statistical research on midpoints. There’s no 100% certainty, of course, but in the long run you can see a pattern that could be highly profitable.
An example of match with midpoints related to Venus in evidence:
World Cup 2018 » Group Stage · Matchday 2 of 3 » Russia – Egypt 3:1 (June 19th 2018 h 20:00 GMT+1)

The first half of this match ended scoreless: 0-0.
Here’s the commentary by goal.com : “The hosts have certainly been the better side but they look short of ideas in this [first half], where they are yet to play a decent cross into Dzyuba. Egypt have been similarly frustrated in their own attempts to attacks, as they come face-to-face with a resilient Russian defence”.
The Scoring Timeline graph below shows the incidence of midpoints involved in the first half of Russia-Egypt:

The -3% negative peak after 25 minutes correspond to the simultaneous presence of the following midpoints:

Here’s the commentary again: “26 mins: Russia continue to focus their attacks on the wide areas, but their final ball into the middle has been lacking“.
In the second half, things suddenly changed and Russia scored 3 goals between 47° and 62° minute:
“47 mins: GOAL! RUSSIA TAKE THE LEAD 1-0! It’s a nightmare start to the second half for Egypt. Zobnin fires a poor shot at goal but it took a huge deflected of Fathy, putting it into the bottom right-hand corner.“

In the Scoring Timeline graph below you can see the very high probability of scoring one or more goals in the second half of this match signalled by midpoints, with a +8% peak around 55° minute, right between the first two goals scored by Russia.

DISCLAIMER: Information is provided with sincere intent, and according to our own studies and methodologies. No guarantees are made. You are solely responsible for any bets placed with bookmakers.
#oroscopo #odds #bettingsystem #firstgoal #system #research #previsione #statistics #geocosmic #scommessa #bet #totalgoals #halftime #horoscope #astrologia #goal #midpoints #pronostico #prediction #betting #statistica #sport #over #underoverbet #astrology #calcio #sistema #football #tips #under #soccer


Commenti